qml.draw_mpl
-
draw_mpl(qnode, wire_order=None, show_all_wires=False, decimals=None, expansion_strategy=None, style=None, *, fig=None, **kwargs)[source]¶ Draw a qnode with matplotlib
- Parameters
qnode (QNode or Callable) – the input QNode/quantum function that is to be drawn.
- Keyword Arguments
wire_order (Sequence[Any]) – the order (from top to bottom) to print the wires of the circuit
show_all_wires (bool) – If True, all wires, including empty wires, are printed.
decimals (int) – How many decimal points to include when formatting operation parameters. Default
Nonewill omit parameters from operation labels.style (str) – visual style of plot. Valid strings are
{'black_white', 'black_white_dark', 'sketch',
'pennylane', 'pennylane_sketch', 'sketch_dark', 'solarized_light', 'solarized_dark', 'default'}
. If no style is specified, the global style set withuse_style()will be used, and the initial default is ‘black_white’. If you would like to use your environment’s current rcParams, setstyleto “rcParams”. Setting style does not modify matplotlib global plotting settings.fontsize (float or str) – fontsize for text. Valid strings are
{'xx-small', 'x-small', 'small', 'medium', large', 'x-large', 'xx-large'}. Default is14.wire_options (dict) – matplotlib formatting options for the wire lines
label_options (dict) – matplotlib formatting options for the wire labels
active_wire_notches (bool) – whether or not to add notches indicating active wires. Defaults to
True.expansion_strategy (str) –
The strategy to use when circuit expansions or decompositions are required.
gradient: The QNode will attempt to decompose the internal circuit such that all circuit operations are supported by the gradient method.device: The QNode will attempt to decompose the internal circuit such that all circuit operations are natively supported by the device.
fig (None or matplotlib.Figure) – Matplotlib figure to plot onto. If None, then create a new figure
- Returns
A function that has the same argument signature as
qnode. When called, the function will draw the QNode as a tuple of (matplotlib.figure.Figure,matplotlib.axes._axes.Axes)
Example:
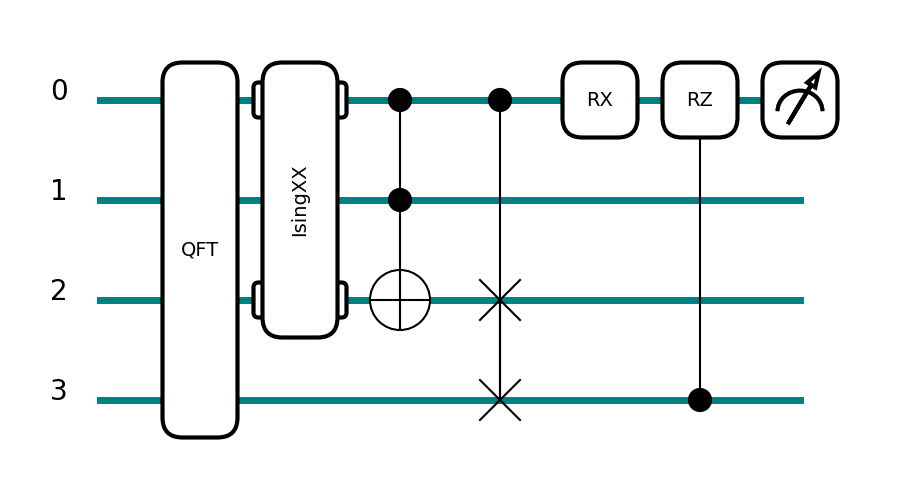
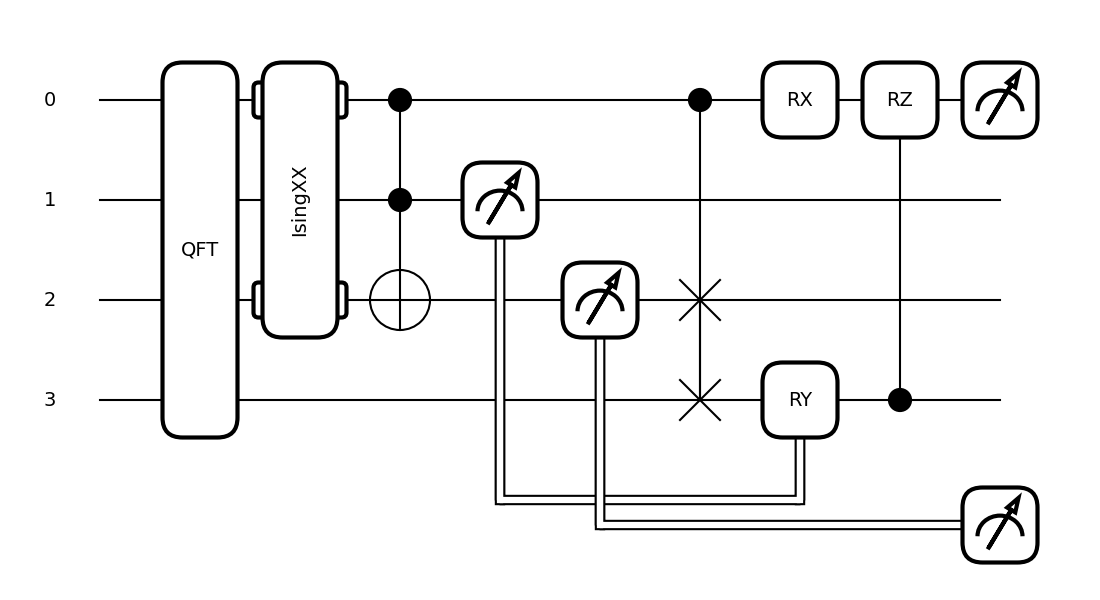
dev = qml.device('lightning.qubit', wires=(0,1,2,3))

@qml.qnode(dev)
def circuit(x, z):
    qml.QFT(wires=(0,1,2,3))
    qml.IsingXX(1.234, wires=(0,2))
    qml.Toffoli(wires=(0,1,2))
    qml.CSWAP(wires=(0,2,3))
    qml.RX(x, wires=0)
    qml.CRZ(z, wires=(3,0))
    return qml.expval(qml.Z(0))


fig, ax = qml.draw_mpl(circuit)(1.2345,1.2345)
fig.show()
Usage Details
Decimals:
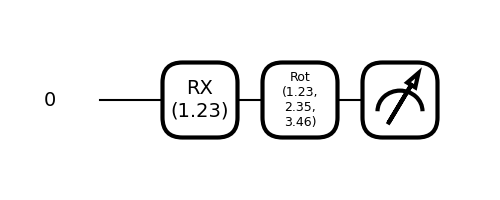
The keyword
decimalscontrols how many decimal points to include when labelling the operations. The default valueNoneomits parameters for brevity.@qml.qnode(dev) def circuit2(x, y): qml.RX(x, wires=0) qml.Rot(*y, wires=0) return qml.expval(qml.Z(0)) fig, ax = qml.draw_mpl(circuit2, decimals=2)(1.23456, [1.2345,2.3456,3.456]) fig.show()
Wires:
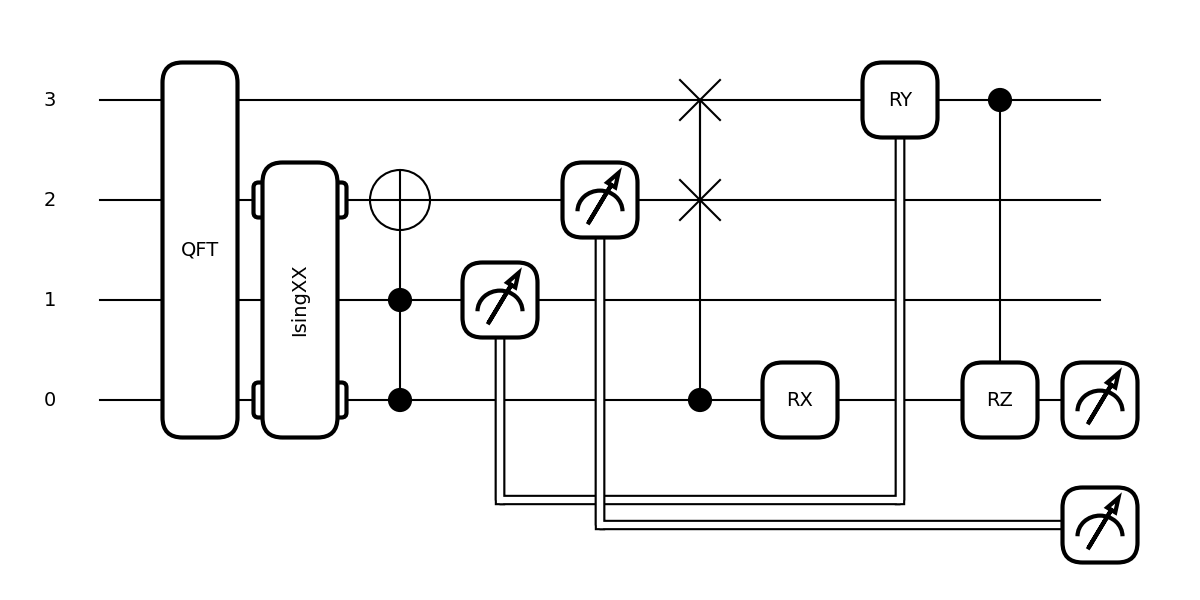
The keywords
wire_orderandshow_all_wirescontrol the location of wires from top to bottom.fig, ax = qml.draw_mpl(circuit, wire_order=[3,2,1,0])(1.2345,1.2345) fig.show()
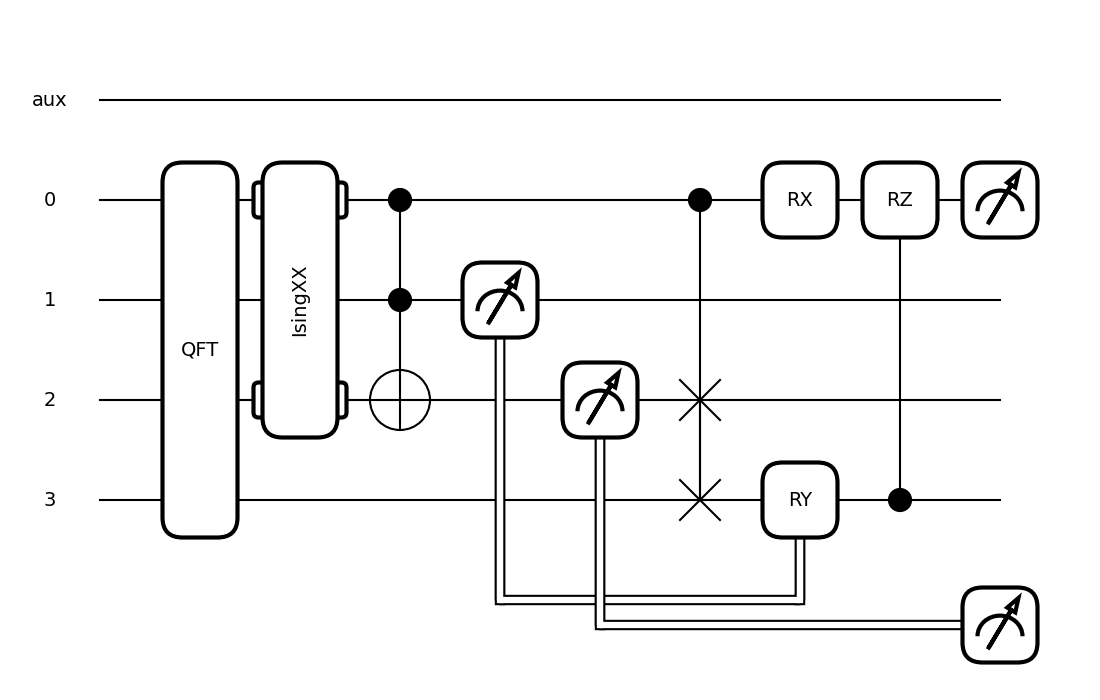
If a wire is in
wire_order, but not in thetape, it will be omitted by default. Only by selectingshow_all_wires=Truewill empty wires be displayed.fig, ax = qml.draw_mpl(circuit, wire_order=["aux"], show_all_wires=True)(1.2345,1.2345) fig.show()
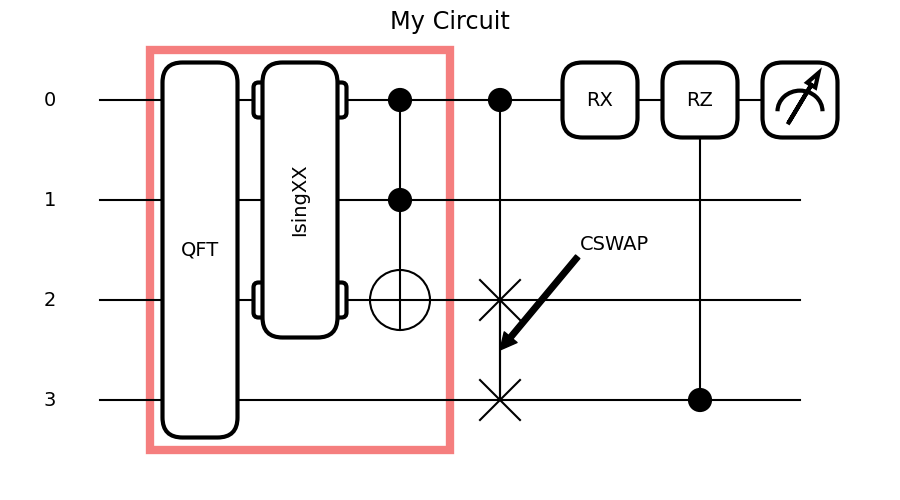
Integration with matplotlib:
This function returns matplotlib figure and axes objects. Using these objects, users can perform further customization of the graphic.
fig, ax = qml.draw_mpl(circuit)(1.2345,1.2345)
fig.suptitle("My Circuit", fontsize="xx-large")

options = {'facecolor': "white", 'edgecolor': "#f57e7e", "linewidth": 6, "zorder": -1}
box1 = plt.Rectangle((-0.5, -0.5), width=3.0, height=4.0, **options)
ax.add_patch(box1)

ax.annotate("CSWAP", xy=(3, 2.5), xycoords='data', xytext=(3.8,1.5), textcoords='data',
            arrowprops={'facecolor': 'black'}, fontsize=14)
fig.show()
Formatting:
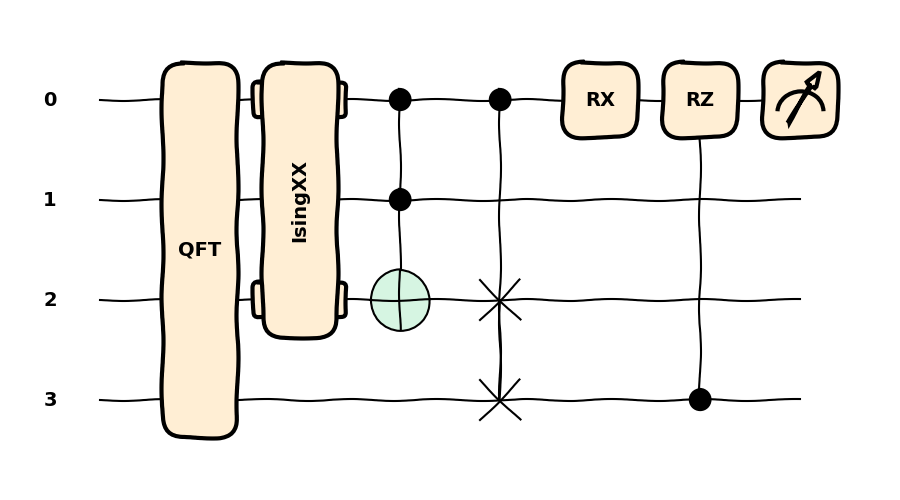
PennyLane has inbuilt styles for controlling the appearance of the circuit drawings. All available styles can be determined by evaluating
qml.drawer.available_styles(). Any available string can then be passed via the kwargstyleto change the settings for that plot. This will not affect style settings for subsequent matplotlib plots.fig, ax = qml.draw_mpl(circuit, style='sketch')(1.2345,1.2345) fig.show()
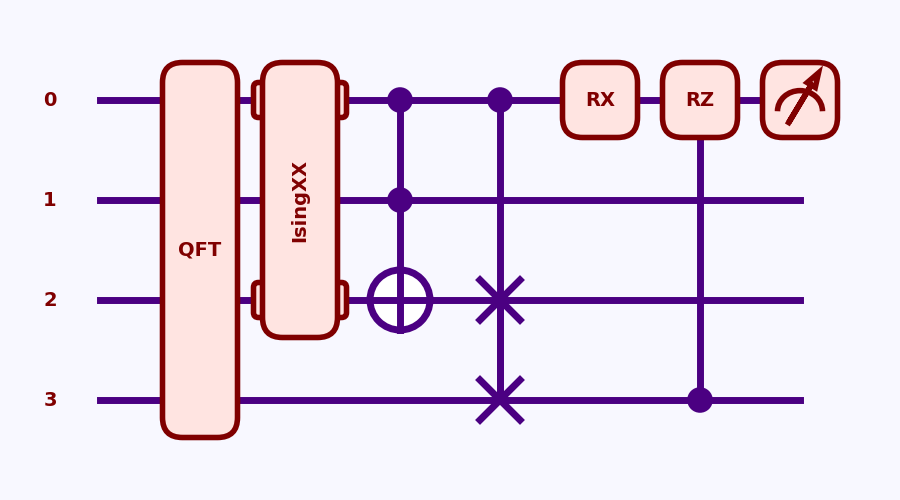
You can also control the appearance with matplotlib’s provided tools, see the matplotlib docs . For example, we can customize
plt.rcParams. To use a customized appearance based on matplotlib’splt.rcParams,qml.draw_mplmust be run withstyle="rcParams":plt.rcParams['patch.facecolor'] = 'mistyrose' plt.rcParams['patch.edgecolor'] = 'maroon' plt.rcParams['text.color'] = 'maroon' plt.rcParams['font.weight'] = 'bold' plt.rcParams['patch.linewidth'] = 4 plt.rcParams['patch.force_edgecolor'] = True plt.rcParams['lines.color'] = 'indigo' plt.rcParams['lines.linewidth'] = 5 plt.rcParams['figure.facecolor'] = 'ghostwhite' fig, ax = qml.draw_mpl(circuit, style="rcParams")(1.2345,1.2345) fig.show()
The wires and wire labels can be manually formatted by passing in dictionaries of keyword-value pairs of matplotlib options.
wire_optionsaccepts options for lines, andlabel_optionsaccepts text options.fig, ax = qml.draw_mpl(circuit, wire_options={'color':'teal', 'linewidth': 5}, label_options={'size': 20})(1.2345,1.2345) fig.show()